





Key ideas
- Isaias made landfall near Destin on October 9 as a Category 2 hurricane, with maximum sustained winds of 105 miles (170 kilometers) per hour.
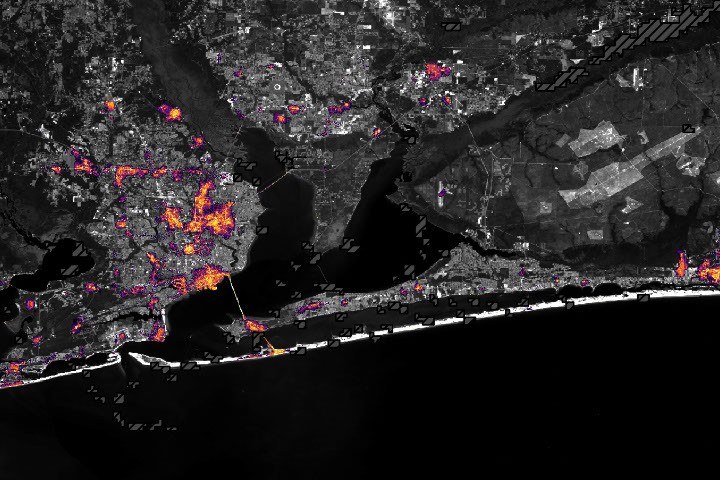
- According to NASA, the data show less illumination in parts of Pensacola and along Route 98; the images alone do not confirm the causes of these patterns.
- NASA reports that some lights had begun to return by October 12 and that by October 14 the patterns resembled those from before the storm.
Observed changes in lights
Isaias became the first hurricane of the 2026 Atlantic season on October 8, as it moved toward the U.S. Gulf Coast. According to NASA, it brought heavy rain and flash flooding to parts of the Southeast, including Alabama and the Florida Panhandle. Its winds toppled trees and power lines, leaving many people without electricity.
The hurricane made landfall near Destin, Florida, on the night of October 9 as a Category 2 storm, with maximum sustained winds of 105 miles (170 kilometers) per hour. According to the National Weather Service, gusts exceeded 100 miles per hour in a corridor west of the storm’s center. Preliminary reports recorded a gust of 117 miles per hour at Oriole Beach and another of 102 miles per hour at Pensacola City Hall.
NASA describes Black Marble HD data, a product that uses observations from the VIIRS instrument on the NOAA-20 satellite. The team processed the data to account for changes in the landscape, atmosphere, and lunar phase, and to filter scattered light that does not come from electric lights. Striped dark gray areas indicate where clouds prevented VIIRS from collecting data; nighttime lights are shown over a Landsat 9 base map. The comparison presented by NASA includes a composite of data from August 2026, representative of typical conditions, and observations from October 11, when most of the storm clouds had cleared.
According to NASA, the data show a marked decrease in lights in parts of Pensacola and along the Route 98 corridor toward Destin, suggesting widespread power outages. NASA also attributes to Ranjay Shrestha, from the Black Marble science team, the observation that lights persisted at Pensacola International Airport, Pensacola Christian College, and parts of downtown Pensacola. The source notes that these patterns could reflect backup systems, differences in electrical infrastructure, or areas that maintained power, but that the images alone cannot confirm the causes.
The comparison of October 11 and 12 shows, according to NASA, that some lights had begun to return in affected areas. By October 14, illumination patterns resembled those from before the storm. NASA says Black Marble HD complements ground reports of outages but does not replace them.
Observed light and electricity supply are different quantities
A nighttime image records light reaching a sensor from space. A drop in brightness may be consistent with power outages, as NASA’s report interprets it, but it is not the same as reading a meter. It does not directly reveal how many homes lack electricity, how much energy stopped being consumed, or what damage each circuit sustained.
NOAA’s VIIRS documentation explains that the instrument combines observation bands to obtain information about the atmosphere and surface. This reference describes the sensor; it does not independently validate the hurricane damage assessment. Maintaining this distinction is essential for using an image as evidence without attributing to it diagnostic capabilities it does not have.
What Black Marble corrects for
NASA’s Black Marble technical description distinguishes recorded radiance from processed products. The algorithm accounts for atmospheric effects, lunar illumination, and observing conditions. Its products include quality indicators, cloud information, and data on when a good-quality observation was obtained.
Those fields are part of the result, not a dispensable addition. A dark pixel may represent less emitted light; a pixel without a valid observation needs to be treated as missing data. Equating the two would introduce an artificial reduction in brightness. It is also unwise to compare a monthly composite with a single night without explaining how the two products differ.
How to interpret an apparent recovery
If lights reappear on successive nights, the observation provides a clue about the recovery of illuminated activity. Its scope remains limited: the scene does not certify that all homes have service, that the grid has been definitively repaired, or that social conditions have returned to their previous state. It is complementary spatial evidence.
To turn the map into an impact assessment, it would need to be linked with grid information, repair reports, and other observations of the area. We would also need to retain the same spatial boundaries and quality rules for each image. Without these checks, we do not publish outage percentages or an invented power-supply curve.
The accompanying diagram shows the interpretation procedure. The sensor and product references make it possible to review how the image is obtained; they do not replace an independent report on the event. The table distinguishes visible indicators from questions that still require another source.
| Available information | Reasonable use | Additional data needed |
|---|---|---|
| Lower nighttime brightness | Locate spatial changes consistent with outages | Power-supply records and observation quality |
| Clouds or invalid pixels | Delimit where we cannot make a comparison | More usable observations; do not fill in with zero |
| Reappearance of lights | Track a recovery in illuminated activity | Local confirmation that homes and services have been restored |
| Monthly composite and isolated night | Provide before-and-after context | Explain periods and combination method |
Explore the explanation
From nighttime light to an interpretation of change
- Observe
Record radiance under known instrument conditions.
- Correct
Account for the atmosphere, Moon, and other recording effects.
- Filter
Retain pixels with sufficient quality and treat missing ones as missing.
- Compare
Examine equivalent areas and periods, with support from grid information.
Methodological diagram. It does not represent percentages of affected households or energy not supplied.
What we know and its limits
Synthesis based exclusively on a NASA institutional excerpt, without independent corroboration. The source states that satellite data complement ground reports of outages and do not by themselves confirm the causes of the observed patterns.
19/10/2026: Context expanded, new references cross-checked, and resources with their provenance added. The original publication date is retained. AI-assisted preparation and automated checks; no human review.
Follow the evidence
The original sources for exploring this explanation and its limits.
- Isaias Dims the Gulf Coast
NASA
NASA institutional communication. The excerpt from the official channel is retained in the editorial file for comparison. - Black Marble: Products, Corrections, and Quality
NASA GSFC
Reference consulted to expand and cross-check the explanation. Its role and limitations are indicated alongside the content. - VIIRS: Visible and Infrared Observation Instrument
NOAA STAR
Reference consulted to expand and cross-check the explanation. Its role and limitations are indicated alongside the content.
Image credits
NASA Earth Observatory / Lauren Dauphin; Black Marble HD: Ranjay Shrestha (NASA GSFC); USGS · Original source · NASA Media Usage Guidelines