




Key ideas
- NASA combines observations of ocean temperature, height, and color: each provides different information.
- The 83 % in the CPC bulletin of 08/10/2026 refers to a forecast RONI threshold for October–December; it does not confirm a record already observed.
- ENSO intensity does not by itself determine the impacts in each region.
What Satellites Observe
NASA describes satellite signals of El Niño. To interpret its intensity and development, we need to distinguish ocean observations, climate indices, and forecasts: they are not interchangeable measurements.
El Niño is a natural climate pattern that occurs approximately every two to seven years and is characterized by warmer-than-normal water temperatures in parts of the equatorial Pacific. According to NASA, it can weaken or reverse the trade winds, redistribute ocean heat, and alter rainfall.
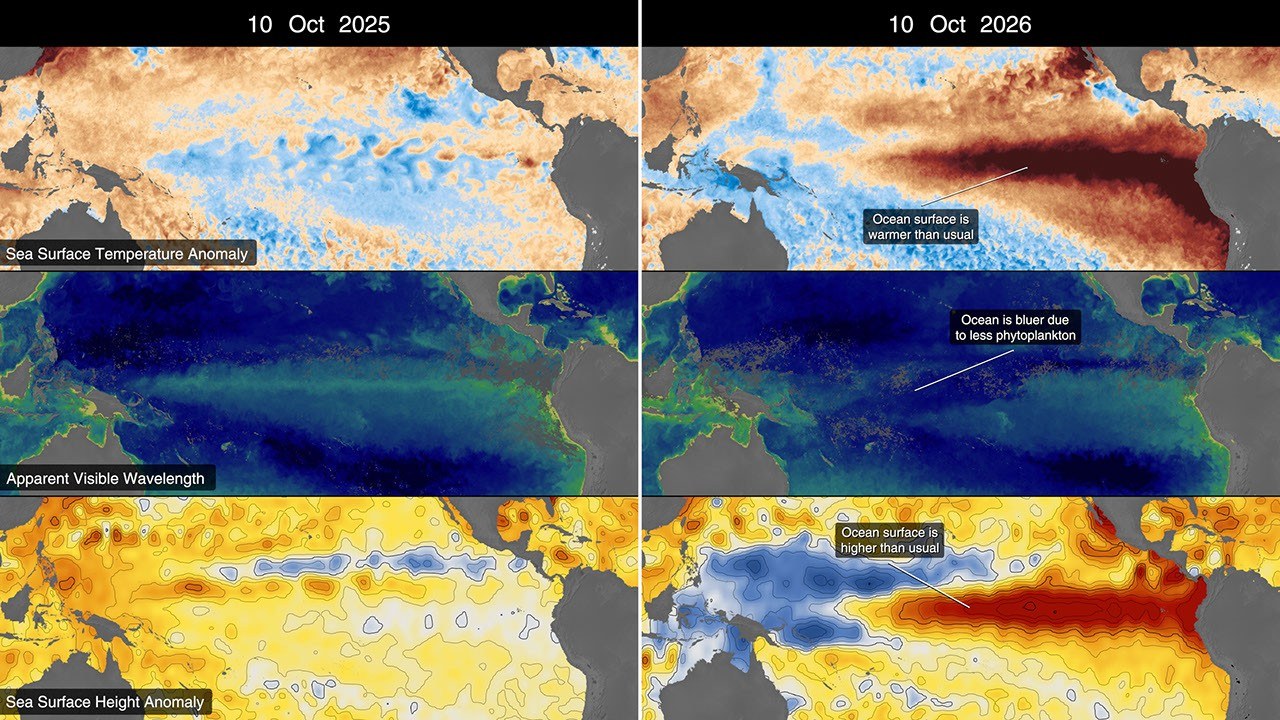
Observations indicate that warm-water Kelvin waves had reached the eastern Pacific by early April and that surface temperatures were beginning to rise. NASA reports local variations in sea level: in some areas, the water was up to 1 to 1.3 feet above normal; around Indonesia and northern Australia, levels were lower than usual.
The Ocean Color Instrument aboard the PACE satellite recorded bluer hues in equatorial zones that are usually greener. NASA associates this change with lower phytoplankton abundance: weakened trade winds reduce the upwelling of nutrient-rich deep water. The decrease may affect the marine food web.
A Coupled System, Not Just Warm Water
The National Weather Service educational material on ENSO describes the relationship between the equatorial ocean and atmospheric circulation. Under typical conditions, the trade winds push surface water westward. Changes in these winds alter the distribution of warm water and the upwelling of cooler water in the east.
This mechanism helps explain why temperature, sea level, and biological conditions can vary together. It does not mean that each indicator measures the same variable. A surface-height anomaly is a difference in level relative to a reference; it should not be read as temperature or confused with the global average rise in sea level.
What the October Bulletin’s Probability Means
The CPC Diagnostic Discussion published on October 8, 2026 distinguishes between periods and thresholds. It gives an 83 % probability that the three-month RONI value will reach at least +2,5 °C in October–December; for September–November it gives 54 % and for November–January 70 %. These are forecasts for different time windows, not parts of a total that can be added together.
The 83 % does not certify a record that has already been measured or describe the probability of an identical impact in every country. The bulletin also discusses the likely persistence of strong or very strong conditions: this wording has a different scope from the three-month threshold. When communicating a probability, we need to retain the variable, threshold, issue date, and forecast period.
Ocean Color and Biological Evidence
NASA’s report adds PACE observations: a change in hues is interpreted in relation to phytoplankton. This is a valuable observation because it connects physical and biological conditions. However, a color variation is not, on its own, a count of all species or a quantitative forecast of fishery catches.
The explanation of upwelling provides a plausible mechanism for this relationship, while specific effects on a food web require further observations. We do not present an abundance curve invented from the colors in an illustration. The table preserves the distinctions between signals, interpretation, and an open question.
How to Track Developments Without Losing Context
Successive bulletins may change as new observations arrive and models are updated. A dated news story does not replace consulting the current diagnostic. The term anomaly also requires identifying the product’s reference; two maps with different scales cannot be compared solely by which one has the more intense red.
To assess a local risk, it is useful to consult regional forecasts and their probabilities. ENSO status provides climate context, but it does not by itself determine a city’s weather or the outcome of a harvest. This additional information clarifies the cited forecast and preserves cautions about causality and geographic scope.
| Indicator | What it describes | What it does not demonstrate on its own |
|---|---|---|
| Surface temperature | Ocean thermal state according to a reference | Future weather in each region |
| Surface height | Distribution and dynamics of water observed by altimetry | A uniform global rise |
| Ocean color | Optical signal interpreted with biological data | A complete count of organisms |
| Three-month RONI probability | A dated forecast of a specific index and threshold | A record already observed or a certain local impact |
Explore the explanation
How to read an El Niño forecast
- Date
Identify when the forecast was issued.
- Variable and threshold
Preserve the RONI index and the intensity level to which it refers.
- Time window
Distinguish each forecast quarter.
- Scope
Separate the episode’s intensity, an observed record, and regional impact.
Guide to interpreting the bulletin of 08/10/2026. It is not a new forecast and does not represent an already measured result.
What we know and its limits
The information comes from an institutional NASA communication citing a NOAA estimate, without independent verification. The excerpt does not make it possible to establish the episode’s subsequent development or its specific effects in each region.
19/10/2026: The dossier is expanded with NOAA sources, and the meaning of the 83 % is clarified: a forecast RONI threshold for October–December, not confirmation of an observed record. Methodological context and resources are added; no human review.
Follow the evidence
The original sources for exploring this explanation and its limits.
- NASA Satellites Observe Historic 2026 El Niño
NASA
NASA institutional communication. The excerpt from the official channel is retained in the editorial file for comparison. - ENSO: Ocean, Atmosphere, and Trade Winds
NOAA · National Weather Service
Reference consulted to expand and cross-check the explanation. Its role and limitations are indicated alongside the content. - ENSO Diagnostic Discussion · October 8, 2026
NOAA · Climate Prediction Center
Reference consulted to expand and cross-check the explanation. Its role and limitations are indicated alongside the content.
Image credits
NASA Scientific Visualization Studio · Original source · NASA Media Usage Guidelines