





Key ideas
- NASA states that current warming is happening at a rate not seen in the last 10.000 years and attributes the trend observed since the middle of the twentieth century to human activities.
- The signals described include changes in temperature, the ocean, ice sheets, glaciers, snow, sea levels, and Arctic sea ice; impacts and risks vary between regions.
- Mitigation aims to reduce emissions or strengthen sinks, while adaptation adjusts activities and plans to reduce risks. The proposed activities are learning exercises, not experiments that have been conducted.
Distinguishing Weather from Climate
To study climate change, it helps to separate two timescales. Weather describes a specific phenomenon—such as a storm or a hot day—that occurs over a short period and can be tracked over hours or days. Climate is the average of the weather conditions in a place over an extended period, 30 years or more. A broader description of climate considers temperatures, rainfall, wind, and other conditions in a region over a longer period. So, a cold or rainy day today does not, by itself, confirm or refute a climate trend.
A question for the class: What data would we need to describe this week’s weather, and what data would we need to characterize a region’s climate? Students could compare a short record with a series spanning many years, if appropriate data are available. The activity helps students think about timescales; it is not equivalent to conducting an experiment and does not, by itself, make it possible to attribute a cause.
Global warming refers to the planet’s long-term warming. Climate change encompasses this warming and other changes, such as rising sea levels, shrinking glaciers, and changes in flowering cycles. NASA notes that Earth’s climate has varied throughout its history, but that current warming is happening at a rate not seen in the last 10.000 years. NASA: evidence of climate change and NASA: effects of climate change
How to Identify Changes Using Evidence
NASA presents evidence of ancient climates from natural sources. Ice cores, tree rings, ocean sediments, coral reefs, and layers of sedimentary rock make it possible to study past climates. Separately, data collected over many years by satellites and other modern instruments make it possible to examine signals and patterns of current climate change. NASA states that the rate of change since the middle of the twentieth century is unprecedented in millennia. A learning activity could involve consulting available records and asking what period they cover, what variable they measure, and what trend they show. This helps distinguish a one-time observation from a prolonged pattern.
The signs described by NASA include rising average surface temperatures, ocean warming, loss of mass from the Greenland and Antarctic ice sheets, retreating glaciers, declining spring snow cover in the Northern Hemisphere, rising sea levels, and a decrease in the extent and thickness of Arctic sea ice. These are different indicators: each provides information about one part of the Earth system.
| Indicator described by NASA | What it shows | Question for analyzing data |
|---|---|---|
| Average surface temperature | An increase in the planet’s average temperature | Is the value a one-time measurement or part of a prolonged series? |
| Heat in the ocean | The ocean has absorbed much of the additional heat | What period and what part of the ocean does the record cover? |
| Ice sheets and glaciers | Loss of mass from ice sheets and retreat of glaciers | What is the difference between observing a glacier and an ice sheet? |
| Mean sea level | An increase related, among other factors, to water from land ice and the expansion of water as it warms | Does the data describe a global trend or a specific location? |
| Arctic sea ice | A decrease in its extent and thickness | What variable is measured, and over what period? |
The table combines indicators summarized by NASA with instructional questions; it does not present results from a school experiment. It also helps distinguish observation from attribution: detecting a change is not enough, by itself, to establish what caused it.
How Human Activities Affect Climate
The natural greenhouse effect is essential for life, but human emissions increase the gases that trap heat and slow its loss into space. NASA explains that burning fossil fuels and deforestation release carbon dioxide. Methane comes from natural and human sources, including landfills, rice cultivation, livestock farming, and leaks from fossil fuel production and transport. Agricultural practices, the production and use of fertilizers, burning fossil fuels, and burning vegetation contribute to nitrous oxide emissions.
NASA attributes the global warming trend observed since the middle of the twentieth century to human activities. The explanation includes the mechanism by which greenhouse gases slow heat loss. The agency also notes that evidence does not support the Sun as an explanation for current warming: among other observations, the surface and lower parts of the atmosphere are warming while the upper atmosphere is cooling. This mechanism and these observations provide context for understanding attribution; they do not constitute independent corroboration of each climate indicator.
In class, students could be asked to classify examples of emission sources—for example, transportation, fuel use, or agricultural activities—and pose questions about what data would make it possible to compare them. Without relevant information, this classification does not make it possible to calculate an emissions footprint or decide which option would be most effective in a particular community.
Impacts and Regional Differences
NASA describes changes that are already happening, such as the loss of sea ice, the melting of glaciers and ice sheets, rising sea levels, shifts in the geographic distribution of plants and animals, and earlier flowering of plants and trees. It also notes more intense heat waves and, among the projected changes, longer and more intense heat waves.
Effects and risks are not the same everywhere. NASA’s information includes regional examples from the United States, such as extreme heat, heavy rainfall, droughts, wildfires, and changes in water availability. Those cases should not be automatically applied to a community in another country. To connect the topic to their surroundings, students could ask: What heat-, water-, or flooding-related risks might matter here? What local information would we need to answer? The cited sources do not provide a specific assessment for every locality.
Exploring Adaptation and Mitigation
Mitigation aims to reduce greenhouse gas emissions or strengthen the sinks that absorb and store them, such as forests, soils, and oceans. Adaptation means adjusting to current or expected climate change to reduce risks. NASA mentions community responses such as planning for heat waves, building flood defenses, installing better-draining pavement, and improving water storage and use. The agency provides scientific information but does not set policy or prescribe particular solutions.
At home or at school, energy use could be analyzed as a starting point for discussing mitigation, or areas that might need shade could be identified and ways to prepare for heat discussed as examples of adaptation. In the community, a class could develop questions about drainage, shade, or water use. These are learning activities, not technical recommendations for a specific place or proof that a measure will work there.
To conclude, each student can choose an action or response and ask: What problem is it intended to address? What local information would be needed to assess it? Who might it affect? The answers can be discussed alongside local data and guidance. These activities help students formulate questions and distinguish objectives; they do not replace a local assessment of risks and measures.
What we know and its limits
The sources describe global signals and regional examples, but do not provide an assessment of impacts or measures applicable to every community. The regional examples cited are from the United States and should not be generalized to other places. The suggested activities are educational proposals, not experimental results or technical recommendations.
Original sources5
The original sources for exploring this explanation and its limits.
- Effects of climate change and limits of projections NASA
- The causes of climate change: mechanisms, observations, and attribution NASA
- Climate change in secondary school: evidence, causes, and activities to understand it NASA
-
Adaptation and mitigation
NASA
Institutional reference for context. It does not constitute independent confirmation of the main source's findings. -
NOAA NASA learning reference
www.nesdis.noaa.gov
Documentation of the study or scientific context. It does not constitute independent corroboration because it belongs to the same organization.
Image credits
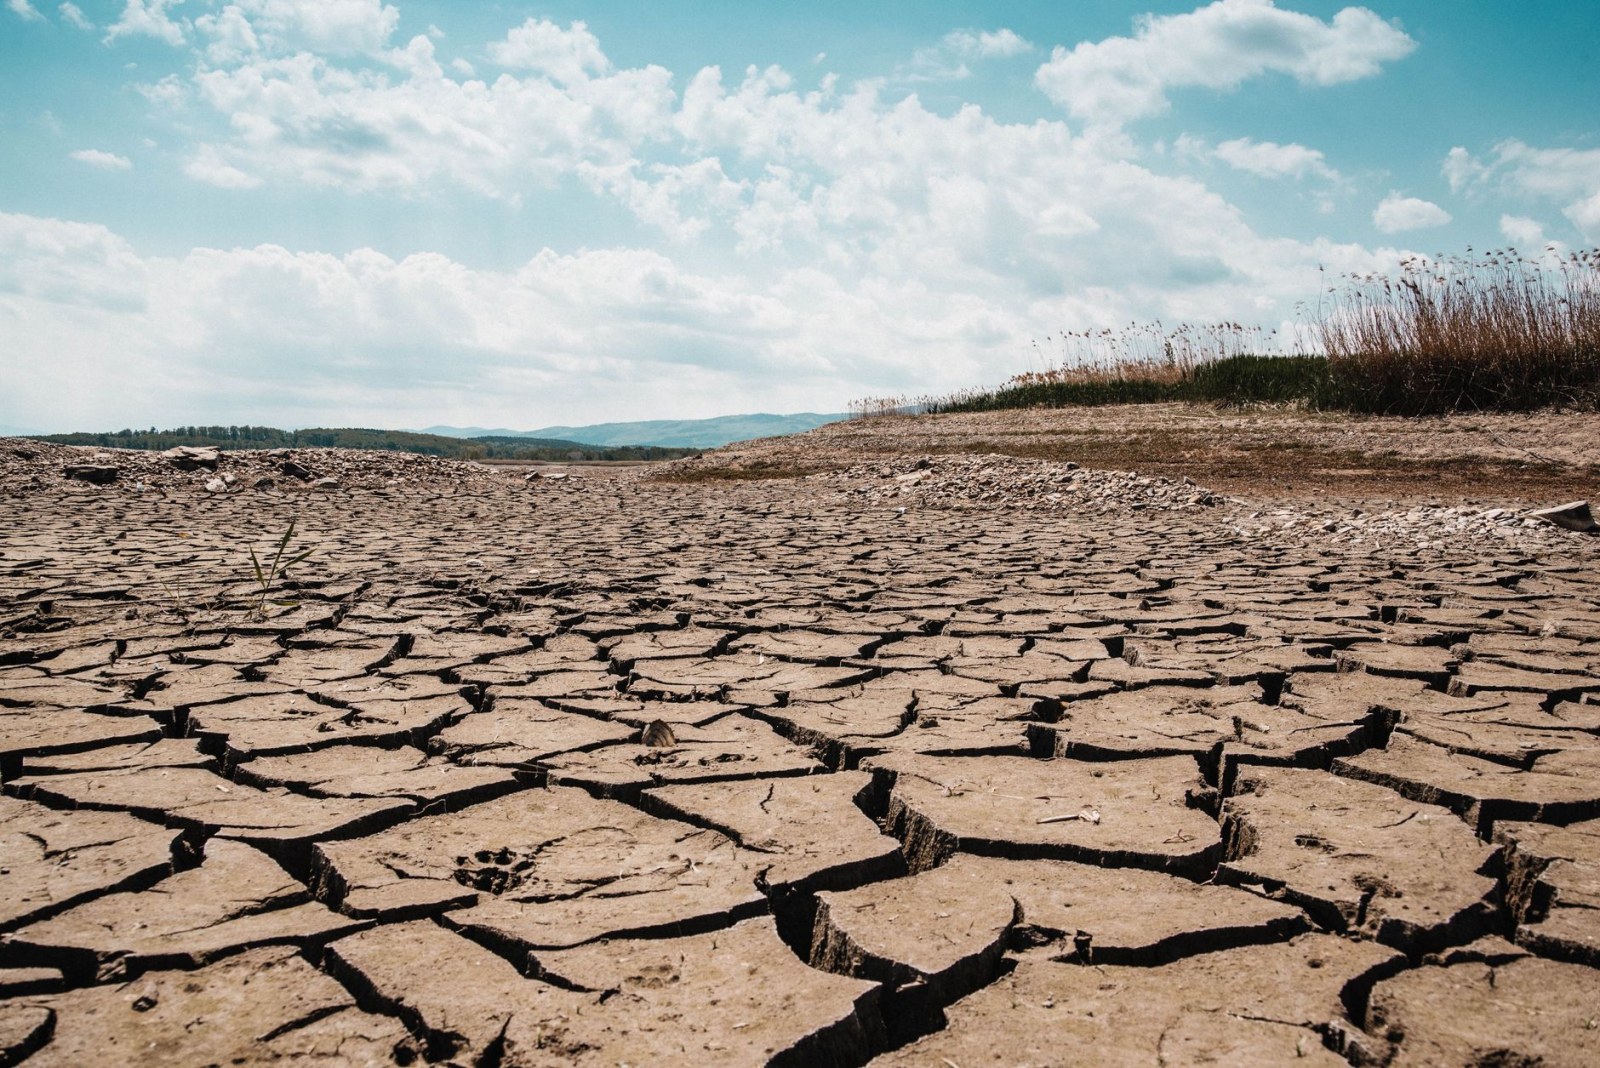
A stark landscape of cracked dry earth beneath a clear blue sky, depicting arid climate and drought. · Photo by Dominika P on Pexels · Original source · Pexels License · Resized and re-encoded as JPEG; full framing preserved.