




Key ideas
- Weather is described on scales of hours or days; climate summarizes average conditions over 30 years or more.
- The documented activities allow students to explore precipitation, dew point, cloud brightness, fronts, and seasons using simulations, maps, or available materials.
- The proposals about storms, lightning, and tornadoes are for the classroom: they do not involve observing severe weather and do not replace official alerts or specialized tools.
Weather and climate: different scales for observing the atmosphere
Weather describes a specific phenomenon—such as rain or a hot day—that occurs in a place over a brief period: it can be tracked over hours or days. Climate, by contrast, characterizes the average weather conditions of a place over an extended period of 30 years or more. This distinction helps prevent a cold or rainy day from being taken as proof of what a region’s climate is like.
The local scale is also connected to broader processes. NOAA explains that the weather we experience depends on interactions among solar radiation, the oceans, landscapes, and Earth’s movement. Uneven heating contributes to global circulation patterns; these global wind patterns drive large air masses, and the place where two air masses meet is called a front. Weather maps can show these fronts indirectly and make it possible to track their movement. NOAA describes a cold front as one in which a cold air mass replaces a warm one, and a warm front as one in which warm air replaces cold air.
An introductory activity that can be done without leaving the classroom is to compare two weather descriptions from different times, if available. Ask the group to separate what the material records from what it interprets: what conditions are indicated, in what place and at what time, what changed, and what additional information would be needed to talk about a climate pattern? To answer questions about climate, records covering a much longer period than a few hours or days are needed. NOAA/NESDIS also explains that temperature and precipitation averages are used to classify climate zones; you can therefore ask which variables appear in the information consulted and which do not.
Precipitation: exploring a simulation with questions
The NOAA/NESDIS educational resource includes a precipitation simulation attributed to CIMSS; the educational content was produced by the NASA Space Place team at the Jet Propulsion Laboratory for NESDIS. In the simulation, air temperature and dew point can be adjusted at four altitudes, and you can observe what type of precipitation reaches the ground; the simulation makes it possible to see that its form can change as it falls. The material explains that dew point is expressed as a temperature: it is the temperature at which water vapor condenses when air cools to that value. It also states that the dew point is equal to or lower than the ambient temperature. In the simulation, moving the air temperature and dew point lines sets the relative humidity shown.
If the simulation is used, it is best treated as an opportunity to describe relationships, not as a prediction of actual outdoor conditions. Before changing the controls, you can ask: what do the air temperature and dew point lines represent, what happens to the type of precipitation when conditions change at different altitudes, and at what point does it seem to change form as it falls? Students can then describe what changed on the screen and what observation supports their explanation.
The material explains that when the air temperature and dew point lines coincide, the relative humidity shown is 100%; if they are far apart, a very low humidity is set. It also warns that with extremely low humidity, there may be no clouds. These relationships can be explored by asking what changes when the two lines are moved closer together or farther apart, what result does the simulation show, and what conclusion is limited to what this resource can represent? The activity does not require conducting physical experiments or going outside to observe a storm.
Satellite images: describe before explaining
A visible satellite image provides an opportunity to practice careful observation. The NOAA/NESDIS educational resource, produced by the NASA Space Place team at the Jet Propulsion Laboratory for NESDIS, proposes exploring how a cloud’s apparent brightness changes when its thickness is modified in a simulation; it also shows that the type of surface beneath the cloud can affect that brightness. Thus, an image should not be interpreted as if each visual difference had only one cause.
Using the available simulation, you can ask the group to change the cloud’s thickness and describe what happens to the brightness when the cloud becomes thinner, and what happens when it becomes thicker? They can then change the type of surface beneath it and ask does its appearance change, which variable was modified, and what cannot be concluded just by looking at the image? These are questions about the documented resource, not a report of an activity conducted here.
| Resource | Question to guide observation | What the documentation says it allows you to explore |
|---|---|---|
| Precipitation simulator | What happens when air temperature or dew point changes at different altitudes? | The form of precipitation that reaches the ground and possible changes as it falls. |
| Simulation of clouds in a visible image | How does brightness change when the cloud’s thickness or the underlying surface is modified? | That thickness and surface type can affect the observed brightness. |
| Available weather map | Where do fronts appear, and which air mass replaces which? | The indirect representation and tracking of fronts described by NOAA. |
Maps and images are representations that make it possible to ask questions, but their interpretation depends on what they show and on the available context. When the classroom has records from a weather station, students can identify which variables were recorded and compare the available observations: which variable changed, over what period, and what information is missing to explain why? The materials provided do not specify a station, a series of measurements, or a particular real-time data platform.
Storms, lightning, and tornadoes: learning without exposure
NOAA explains that local weather is connected to air masses and fronts, and that their movement is also affected by processes in the atmosphere. Separately, it notes that local conditions include factors such as geography, latitude, humidity levels, and the absorption of solar energy. To explore a storm in the classroom, students can analyze descriptions or materials already available and ask what is observed and what is being inferred, what data would support an explanation, and what aspects remain unresolved? There is no need to go outside to observe storms or try to produce dangerous phenomena.
The NOAA National Weather Service reference describes lightning as a large discharge of static electricity and notes that scientists do not fully understand how it works. It also indicates that lightning is more common in thunderstorms. A reading activity could involve identifying what the material explains and what it acknowledges as uncertain: what definition does it give, and what part of how it works is still not fully understood?
NOAA’s page on tornadoes describes several formation processes. Most form from supercell thunderstorms, although there are other types; in addition, a tornado can touch the ground without a condensation funnel being visible. The source lists scientific questions that remain open, including why most supercell thunderstorms do not produce tornadoes and how exactly they form. The group can compare claims supported by the page with questions that remain open, without attempting to diagnose a storm based on its appearance.
Safety is a priority: the proposed activities are limited to the classroom and available materials. NOAA’s page on tornadoes explains that when conditions become favorable for severe weather, the National Weather Service’s Storm Prediction Center may issue a tornado watch; if a tornado is imminent or underway, tornado warnings are issued based on the storm’s path. A school interpretation of maps or images does not replace official alerts. This guide is not a substitute for or equivalent to the CIMSS webapps collection.
Seasons: connecting annual patterns with Earth’s tilt
The NASA Space Place explanation states that seasons are caused by the tilt of Earth’s axis: as Earth orbits the Sun, different parts of the planet receive the Sun’s rays more directly at different times of the year. When the North Pole tilts toward the Sun, more sunlight reaches the Northern Hemisphere; when it tilts in the opposite direction, less sunlight reaches it. The hemispheres experience seasons at opposite times.
To accompany a reading or diagram from the resource, you can ask which hemisphere is tilted toward the Sun in the situation shown, what relationship does the source propose between the tilt and the amount of light, and why do the seasons in the Northern and Southern Hemispheres occur at opposite times? The page also explains that the distance between Earth and the Sun is not the cause of the seasons. This discussion connects seasonal changes with longer-term patterns, but does not turn an observation from a single day into a description of the climate.
What we know and its limits
The documentation describes educational resources and general explanations, but does not provide results from activities conducted, specific data from a weather station, or instructions for a particular real-time observation platform. The references on lightning and tornadoes provide institutional context, not independent corroboration of the primary source. The simulations are useful for exploring the variables they represent; they do not replace weather observations, forecasts, or official alerts.
Original sources7
The original sources for exploring this explanation and its limits.
- Learn about weather and climate with maps, satellites, and questions for the classroom NOAA
-
Lightning
NOAA National Weather Service
Institutional reference for context. It does not constitute independent confirmation of the main source's findings. -
Tornadoes
NOAA
Institutional reference for context. It does not constitute independent confirmation of the main source's findings. -
NOAA NASA learning reference
www.nesdis.noaa.gov
Documentation of the study or scientific context. It does not constitute independent corroboration because it belongs to the same organization. -
NOAA NASA learning reference
www.nesdis.noaa.gov
Documentation of the study or scientific context. It does not constitute independent corroboration because it belongs to the same organization. -
NOAA NASA learning reference
www.nesdis.noaa.gov
Documentation of the study or scientific context. It does not constitute independent corroboration because it belongs to the same organization. -
NOAA NASA learning reference
spaceplace.nasa.gov
Documentation of the study or scientific context. It does not constitute independent corroboration because it belongs to the same organization.
Image credits
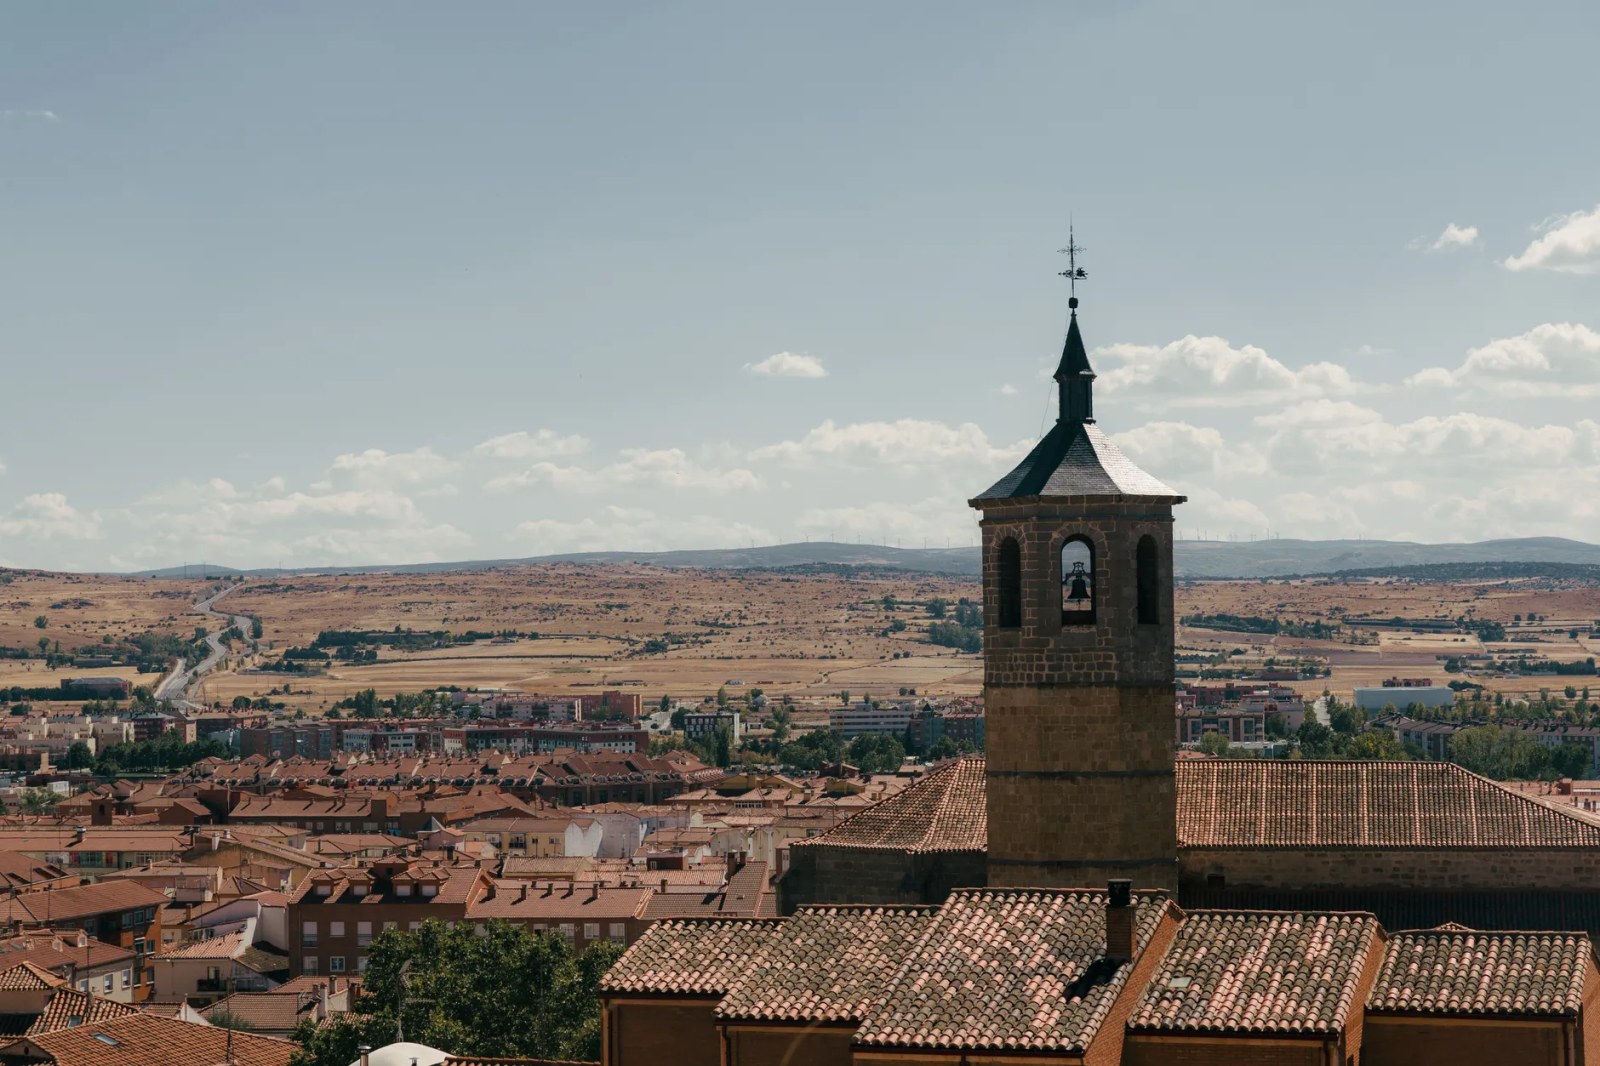
View over Ávila, Spain, featuring a historic bell tower under a clear sky. · Photo by Ludovic Delot on Pexels · Original source · Pexels License · Resized and re-encoded as JPEG; full framing preserved.