





Key ideas
- The LASCO activity proposes tracking a feature of a CME in five images; this worksheet records positions and average speeds using the solar diameter of
1.4 × 10^6 kmas the scale. - The matching activity compares five magnetic images with five extreme ultraviolet images and allows students to check their proposals against the resource’s answer key.
- The exercises use historical educational sequences: on their own, they do not describe current solar activity or predict space weather.
Two educational activities with SOHO images
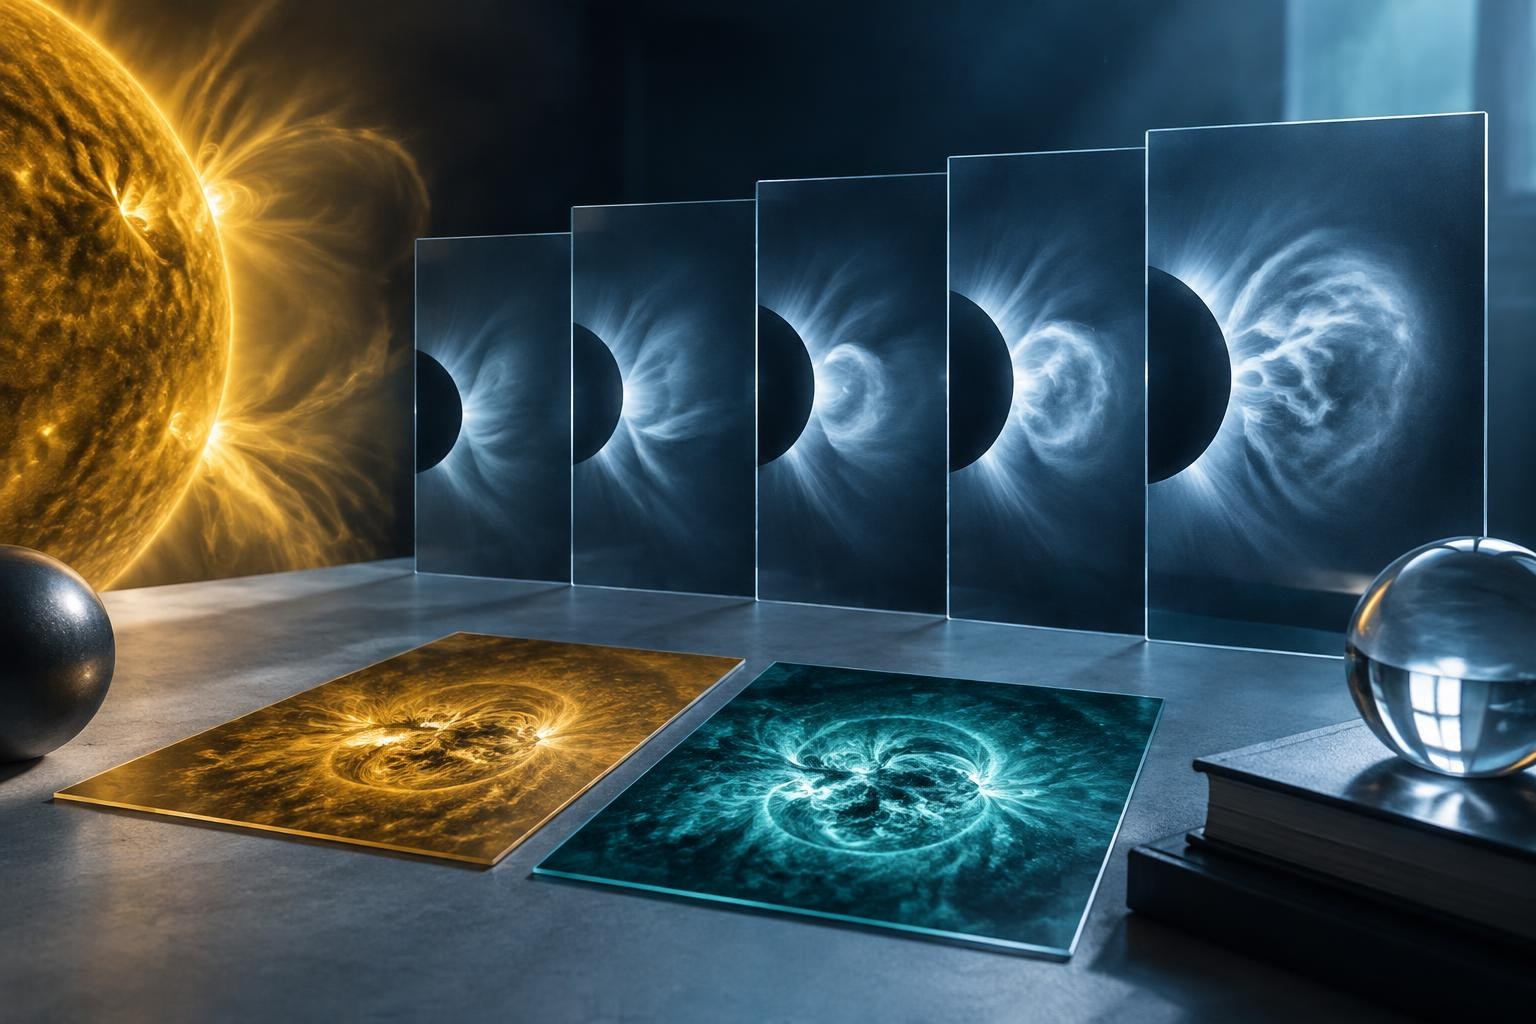
SOHO / NASA and ESA presents two exercises based on solar images. The first proposes calculating the speed and acceleration of a coronal mass ejection (CME) from its position in a series of five LASCO images. The second involves matching images of magnetic activity with solar images in extreme ultraviolet. The CME measurement activity and the LASCO image educational sequence describe the first exercise; the matching activity presents the second.
The LASCO images in the activity correspond to 08:05, 08:36, 09:27, 10:25 and 11:23. The matching exercise uses five magnetic images and five ultraviolet images; each pair was taken at approximately the same time on one day, and the pairs correspond to five different days. These are historical educational sequences: on their own, they do not describe current solar activity or constitute a space weather forecast.
For working on paper, the CME material specifies images, a ruler and a calculator; it also allows measurements to be taken on screen. The matching activity can be done online or with printed images, individually, in class or in small groups. Teachers can adapt the mathematical level to the group when working with positions, time intervals and the formulas provided. The cited documentation does not support claiming that an official course, age group or duration has been established for these activities. They are image-based exercises and do not require direct observation of the Sun.
Activity 1: estimating the motion of a CME
The objective is to choose a visible feature in the five images, record its position and use the times to estimate how its motion changes. In SOHO’s description, the black disk of the coronagraph obscures the solar disk and inner corona. The white circle indicates the Sun’s size and position; the marks at the bottom indicate units of its diameter. The scale given for the solar diameter is 1.4 × 10^6 km (1.4 million kilometers).
The guide suggests following, for example, the outer edge of the bright structure or the inner edge of the dark loop. To compare measurements, it is helpful to use the same criterion in each image and note which feature was selected. The estimated position depends on that criterion and on how accurately the feature can be identified throughout the sequence.
Documented materials: SOHO images and, when working on paper, a ruler and a calculator. The activity also allows measurements to be taken on screen.
Procedure
-
Choose a recognizable feature in the five images and note what it is.
-
Measure its position from the same reference point in each image, on screen or on a printed copy.
-
Convert the measurement to a real position using the proportion specified by SOHO:
d_screen / d_real = s_screen / s_reald_screenis the solar diameter measured on screen;d_realis the real diameter of the Sun;s_screenis the measured position of the feature, ands_realis its converted position. Solve fors_realand keep the units consistent. -
Calculate the average speed between two images as the change in position divided by the change in time:
v = (s₂ − s₁) / (t₂ − t₁)
The official activity also proposes studying acceleration. This worksheet is limited to measuring positions and estimating average speeds; it does not add acceleration calculations based on average speeds with undefined reference times.
The table organizes the measurements and calculations. The times come from the sequence; the remaining cells are completed during the exercise and do not contain calculated results.
| Universal time | Position measured on screen | Converted position | Time interval | Average speed |
|---|---|---|---|---|
| 08:05 | — | — | ||
| 08:36 | ||||
| 09:27 | ||||
| 10:25 | ||||
| 11:23 |
Then, the guide proposes choosing another feature and repeating the analysis: do the estimates of speed and acceleration change? If two groups follow different features, what does it mean to ask which result is “correct”? SOHO notes that several points on a CME can be considered to get an overall picture, and asks how much error may be introduced by the difficulty of tracking a feature. It also invites students to investigate how the CME’s size changes and what forces might act on it. These are questions to explore, not conclusions drawn from the images in the activity.
Activity 2: matching magnetic and ultraviolet images
The activity presents five black-and-white magnetic images, identified from A to E, and five yellow solar images in extreme ultraviolet, numbered from 1 to 5. According to SOHO, each pair was taken at approximately the same time on one day, and the images come from five different days. The resource proposes doing the exercise online or with printed images, individually, in class or in small groups.
In the magnetic images, black and white represent opposite magnetic poles and reveal areas of intense magnetic activity. In the ultraviolet images, areas of more intense activity appear brighter. SOHO describes regions of intense activity as frequent sources of solar storms; this does not prove that a particular region caused a specific storm.
Procedure
- Observe the magnetic and ultraviolet images before consulting the answer key.
- Propose a match for each magnetic image, comparing the shape and distribution of the patterns.
- Note the visual similarities that support each proposal.
- Once you have proposed all five pairs, compare your choices with the resource’s answer key.
| Magnetic image | Proposed ultraviolet image | Similarities observed | Comparison with answer key |
|---|---|---|---|
| A | |||
| B | |||
| C | |||
| D | |||
| E |
The exercise offers practice in comparing representations and justifying matches using spatial patterns. The answer key can be used to check the pairs expected by the activity; it does not predict a CME or prove that a specific region caused a storm. NASA’s Sun page offers general context, but does not independently confirm the results of the SOHO activities.
Interpreting the measurements and matches
In the LASCO exercise, estimates depend on the feature selected, the consistency of the measurements and how accurately it can be tracked between images. Therefore, different groups may obtain different values. Recording the feature and the measurement criterion helps interpret these differences. The guide proposes repeating the analysis with another feature and considering possible tracking error, but does not provide calculated positions, speeds or accelerations.
In the matching exercise, the task is to identify similarities and check the matches expected by the resource. Together, the two activities offer opportunities to practice measurement, calculation and comparison using historical SOHO images. Their scope is limited to those sequences and the exercises described: on their own, they do not represent current solar activity or serve as space weather forecasting tools.
References
What we know and its limits
In the LASCO activity, positions and calculations depend on the feature selected and the accuracy of the measurements; the material does not provide solved numerical results. The matching exercise compares patterns in magnetic and ultraviolet images, but does not by itself prove the origin of a storm or provide a forecast. The conclusions are limited to the sequences and educational activities described.
Original sources4
The original sources for exploring this explanation and its limits.
- Activities with real SOHO data: measuring a coronal ejection and comparing solar images SOHO / NASA and ESA, classroom activities
-
Matching Magnetic Activity and Active Regions
SOHO / NASA and ESA
Institutional reference for context. It does not constitute independent confirmation of the main source's findings. -
Sun Facts
NASA
Institutional reference for context. It does not constitute independent confirmation of the main source's findings. -
SOHO LASCO CME teaching image sequence
SOHO / NASA and ESA
Primary resource actually retrieved for this educational guide; historical teaching data, not current observation.
Image credits
Editorial illustration by SciClue