


Key ideas
- The Census of Marine Life was an international program from 2000–2010 that studied diversity, distribution, and abundance using complementary projects and methods; it did not aim to count every animal in the ocean.
- Records, samples, sequences, and tracks answer different questions. Their interpretation depends on the method, effort, scale, and coverage of each study.
- OBIS maintains a data legacy that includes contributions made both before and after the Census; its maps reflect both the life observed and the inequalities in sampling.
A census of questions, not a count of every animal
The Census of Marine Life was an international research program spanning 2000–2010. Its goal was to improve understanding of marine diversity, where organisms are distributed, and, when methods allowed, how abundant they are. It did not aim to count every animal in the ocean, nor was it the first discovery of all marine life. It combined exploration, databases, and analyses of the past and of possible future scenarios, with national and regional projects and committees.
The closing report describes more than 2,700 scientists from more than 80 countries, and more than 670 laboratories, universities, museums, and aquariums. The collaboration connected field teams, taxonomists, collections, laboratories, and data specialists; not all regions had the same capacity or could contribute the same kinds of information. The inventory depended both on obtaining observations and on identifying organisms and making records comparable.
Three concepts help put these results in context. Species richness is the number of species recorded in a sample or region; it depends on what was sought, where, and with what effort. Distribution describes where organisms are found, including their depth and temporal variation. Abundance requires a quantity tied to a method and a relevant unit, such as an area or volume, as well as sampling effort. Therefore, the number of records in a database does not automatically equal the number of individuals, species, density, or total abundance.
Different methods, different observations
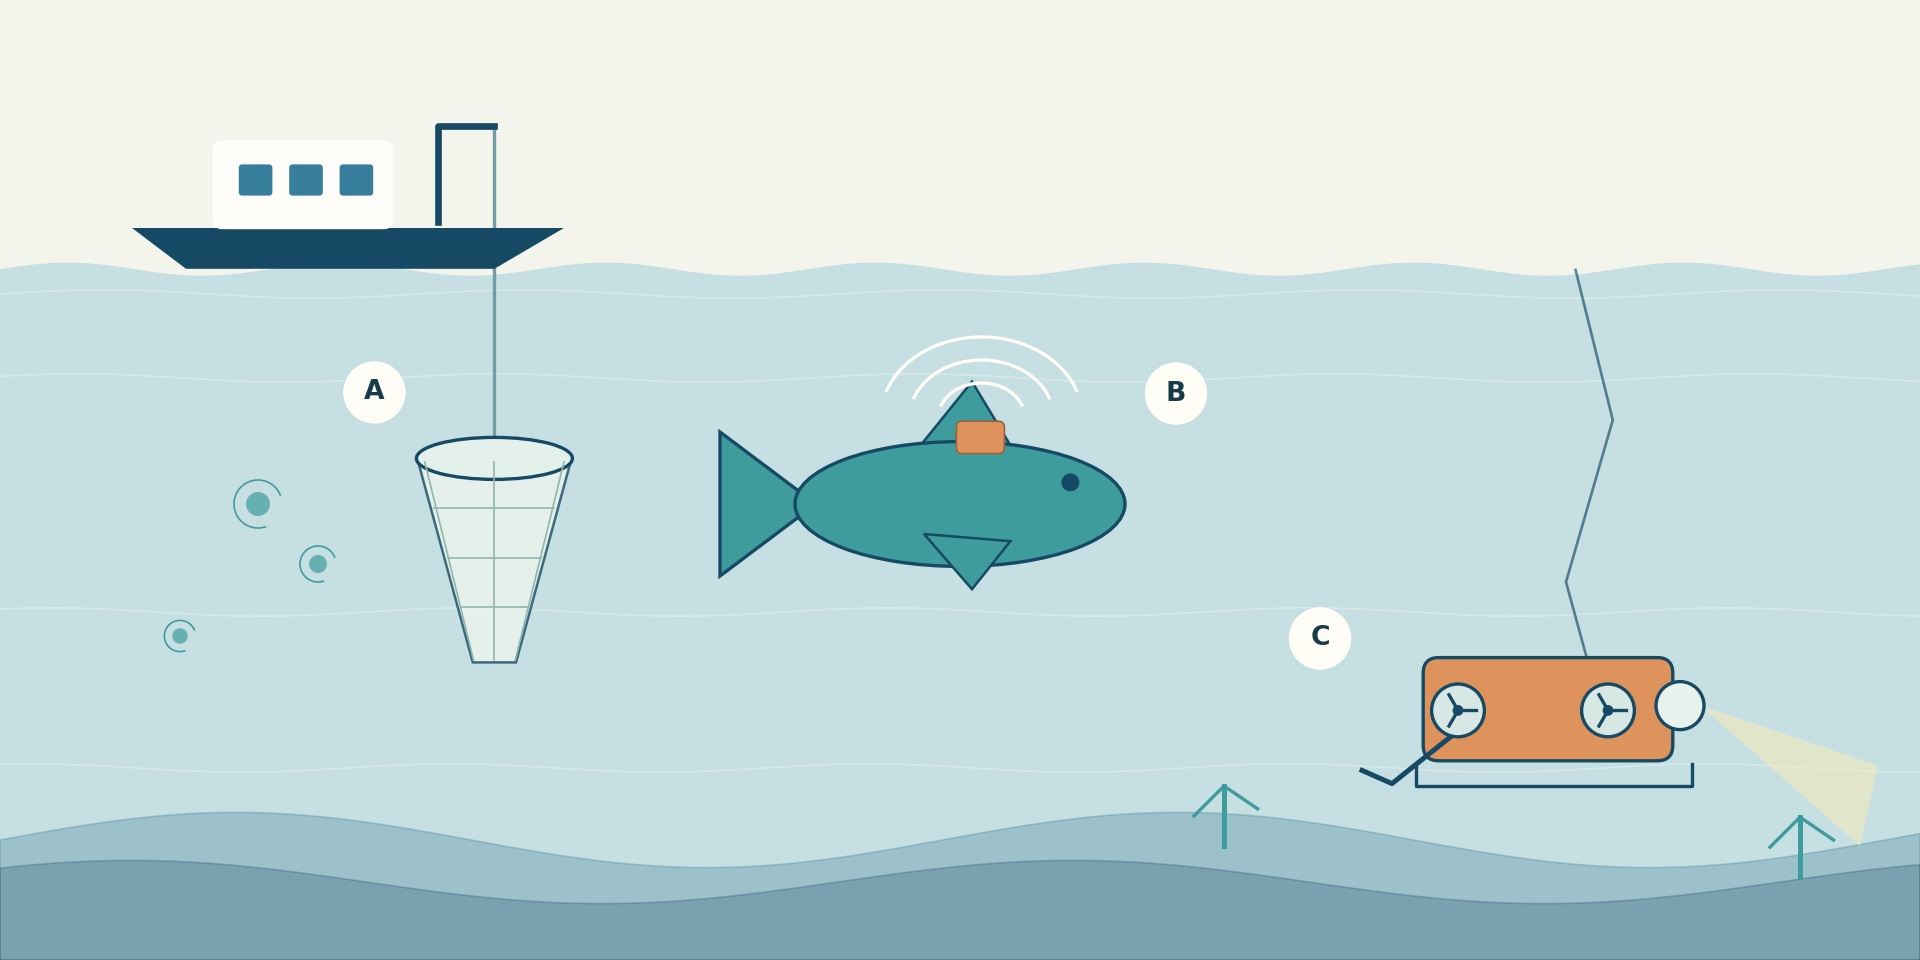
No instrument observes all organisms and habitats. The Census combined techniques that produce different kinds of evidence: captures for examining specimens, images of what is visible, acoustic signals, the tracks of tagged animals, and molecular analyses. The table summarizes what each approach can contribute and what should not be inferred from it.
| Method | Information provided | Main limitation |
|---|---|---|
| Nets and other specimen sampling | Captured organisms that can be identified and, depending on the design, counted or measured. | Capture depends on the equipment, mesh, depth, and effort; by itself, it does not represent the entire community. |
| Diving, cameras, and underwater vehicles | Images or videos of observed organisms and habitats. | They record only what enters the field of view and can be detected under those conditions. |
| Acoustics | Signals and patterns consistent with organisms or aggregations in the water column. | A signal is not in itself a species identification or a universal count of individuals. |
| Electronic tracking | Movements and depths of instrumented individuals. | The routes of tagged animals do not automatically describe an entire population or species. |
| Specimen barcodes | Genetic markers that complement the taxonomic identification of collected organisms. | The sequence helps with identification; by itself, it does not turn each result into a newly formally described species. |
| Microorganism sequences | Diversity of molecular marker fragments present in specific samples. | Rare types or sequences are not equivalent to a complete list of species or to global abundance. |
Microbial studies illustrate the latter distinction. As part of the International Census of Marine Microbes (ICoMM), Sogin and colleagues used high-throughput sequencing in 2006 of fragments of a bacterial ribosomal marker in samples from deep waters of the North Atlantic and diffuse flows from hydrothermal vents. They found far greater sequence diversity than previous estimates and numerous low-frequency types, described as part of the rare biosphere. The result characterizes the samples and the technique used: it is not an exhaustive catalog of formally described species or a census of global microbial abundance.
Maps of richness, depth, and movement
The program brought together studies of coasts and the open ocean, the surface, water column, and seabed, across different habitats and regions. Some projects reconstructed past changes: HMAP drew on sources including ships’ logs, records, and remains. Others explored model-based scenarios: FMAP did not observe the future, but developed projections subject to assumptions. These lines of work allow different questions to be asked and should not be confused with simultaneous measurements of all the oceans.
A 2010 analysis compared richness patterns across 13 major groups. It found peak richness for coastal species in the western Pacific, while several oceanic groups showed peaks across broad bands of mid-latitudes. Sea surface temperature was closely related to the diversity of the groups analyzed, but that association does not demonstrate a single cause: habitat and history also mattered for coastal species. The pattern is not a universal map of all marine species.
Predator tracking shows another scale of observation. The Tagging of Pacific Predators (TOPP) program tagged individuals in the North Pacific; a paper published in 2011 analyzed tracking data from 2000–2009 and described routes and aggregation areas associated with ocean structures. This is a later result based on data from the Census decade, not an extension of the program’s formal period to 2011. The tracks of the individuals followed provide information about their movements, not the distribution of all populations.
At the close of 2010, NOAA summarized more than 1,200 formally described marine species resulting from work related to the program, as well as other species awaiting description. It also reported about 30 million integrated records. These records are not 30 million animals counted: they may represent observations of different types, places, dates, and methods. Nor are they a current counter for OBIS. A formally described species, a new record, and an observation of a known species are different results.
Read the gaps before interpreting a map
Coverage was uneven across space, time, depth, and taxonomic groups. An analysis of OBIS records published in 2010 found a strong concentration of data in shallow waters and underrepresentation of the intermediate and deep pelagic waters. This lack of records does not demonstrate that there is no life there: in part, it shows where observations had been made and documented.
A zero can be interpreted as absence only if the design, effort, and detection capability are adequately documented. In addition, the sources brought together may correspond to different periods, methods, and units. Comparing richness or abundance requires reviewing these metadata; checking names, coordinates, or dates improves data consistency, but does not by itself correct coverage biases or turn a presence into a population estimate.
OBIS: a legacy that continues to grow
The Ocean Biodiversity Information System (OBIS) emerged within the Census and was adopted in 2009 by UNESCO’s Intergovernmental Oceanographic Commission within IODE. Today it operates as a network of nodes that aggregates georeferenced data, including historical data and contributions made after the Census. Therefore, OBIS is not a database frozen in 2010, and its current records should not all be attributed to that decade.
Depending on the dataset, users may find occurrences, sampling events, measurements, and metadata. Names are checked against taxonomic resources such as WoRMS, and quality controls are applied to fields and values. This helps with interpretation and locating problems, but does not guarantee that every field is complete or that a region has been well sampled. WoRMS is for names and synonyms; it is not a census of abundance.
To explore or download data, the OBIS manual describes the use of Mapper, the API, and analysis tools. It is useful to check the method, observation date, depth, effort, quality flags, and dataset version. The update date is not necessarily the sampling date. Mapper downloads do not include absence records by default; some options allow them to be requested when available. Reuse conditions also vary by dataset: free access does not mean unrestricted permission.
Two CMarZ datasets show how to consult specific legacies without treating them as global maps:
| Resource | Contents and how to interpret its scope |
|---|---|
| Zooplankton collected with nets at five stations in the Sargasso Sea and North Atlantic in April 2006, with identification by specialists. The page provides metadata and a CSV file; the indicated version is from 2013. It is a specific cruise, not a representative sample of the entire ocean. | |
| Barcodes and other genetic data for calanoid copepods and euphausiids. The page indicates observations from 1989–2001 and a 2010 version: its incorporation into the Census legacy does not mean all sampling took place between 2000 and 2010. |
When interpreting any record, distinguish taxon, observation date, location and depth, method, unit or count, provider, quality, and version. Without this information, an isolated figure may seem more precise or comparable than it really is. Ultimately, mapping marine life is a synthesis of partial observations: it can reveal patterns and guide new questions, provided it is read alongside its methods and gaps.
What we know and its limits
Marine coverage was uneven across regions, periods, depths, and taxonomic groups; in particular, intermediate and deep pelagic waters were underrepresented in the historical analysis cited. The methods detect different aspects and do not by themselves produce comparable estimates of abundance. The patterns described are limited to the groups, samples, and periods studied; a gap in records does not demonstrate absence, and OBIS results depend on the metadata, quality, and conditions of each dataset.
Original sources13
The original sources for exploring this explanation and its limits.
-
A Census of Marine Biodiversity Knowledge, Resources, and Future Challenges
Costello y colaboradores · PLOS ONE
· doi:10.1371/journal.pone.0012110
2010 scientific synthesis on marine biodiversity, regions, and knowledge gaps. -
What is the Census of Marine Life?
NOAA National Ocean Service
Institutional overview of the international project and its historical results. -
First Census of Marine Life 2010: Highlights of a Decade of Discovery
Census of Marine Life · copia preservada por JAMSTEC
· Informe de 2010
Closing report on the Census’s objectives, methods, projects, and legacy. -
Biodiversity’s Big Wet Secret: Under-Exploration of the Deep Pelagic Ocean
Webb, Vanden Berghe y O’Dor · PLOS ONE
· doi:10.1371/journal.pone.0010223
2010 analysis of the vertical bias in marine records. -
Global patterns and predictors of marine biodiversity across taxa
Tittensor y colaboradores · Nature / PubMed
· doi:10.1038/nature09329
2010 study comparing species richness patterns across different marine groups. -
Tracking apex marine predator movements in a dynamic ocean
Block y colaboradores · Nature / PubMed
· doi:10.1038/nature10082
TOPP result published in 2011 based on tracking conducted from 2000–2009. -
Microbial diversity in the deep sea and the underexplored rare biosphere
Sogin y colaboradores · PNAS
· doi:10.1073/pnas.0605127103
2006 study of microbial sequence diversity in ocean samples. -
Ocean Biodiversity Information System: history and operation
Fisheries and Oceans Canada
History of OBIS, its network of nodes, and institutional continuity after the Census. -
OBIS Manual: data access and download
OBIS / IOC-UNESCO
Querying original datasets and subsets using the viewer, API, and analysis tools. -
OBIS Manual: quality control
OBIS / IOC-UNESCO
Taxonomic and value checks, fields, and quality flags. -
OBIS Manual: data types and reuse conditions
OBIS / IOC-UNESCO
Guide to occurrences, events, measurements, metadata, and dataset licenses. -
CMarZ: zooplankton species from the RHB0603 cruise
Wiebe y colaboradores · BCO-DMO
· BCO-DMO dataset 3295
2006 data from the Sargasso Sea and North Atlantic, with identifications by specialists. -
CMarZ: barcodes and other genetic data for zooplankton
Ann Bucklin · BCO-DMO
· BCO-DMO dataset 2490
Dataset of calanoid copepods and euphausiids with molecular identification data.
Image credits
Editorial Team · original educational illustration · Original source · Recurso editorial propio · derechos reservados · Conceptual illustration of sampling with nets, animal tracking, and underwater observation. Organisms and positions are symbolic; it does not represent an expedition, a map, or real data, and is not to scale.